Published on
Urgent message: Increase in the proportion of value-add time during an encounter was associated with an increased rate of positive perceptions of timeliness and overall patient experience in pediatric urgent care centers.
Aimy Patel, MD; Brian R. Lee, MPH, PhD; Amanda Montalbano, MD, MPH; and Amanda Nedved, MD
Citation: Patel A, Lee BR, Montalbano A, Nedved A. Retrospective study on the impact of increased value-add time on patient experience in pediatric urgent care centers. J Urgent Care Med. 2023;17(5):20-27.
Key words: Acute care, patient experience, length of stay
ABSTRACT
Objective: While length of stay (LOS) has been shown to be inversely related to patient experience scores in acute care settings, Lean dogma prioritizes increasing value-added (VA) time during an encounter. We evaluated the impact of process improvements to increase the proportion of LOS considered to be VA time on patient experience scores.
Methods: This retrospective study of 4 years of encounters in three pediatric urgent care centers included all visits with an associated patient experience survey. LOS was total time from registration to departing the building. VA time was defined as the time from nurse triage documentation to discharge order placed. Outcome measures were positive perceptions of timeliness and overall visit ratings obtained via patient experience surveys.
Results: Median LOS declined from 80 minutes in fiscal year 2018 to 75 minutes in fiscal year 2021. Over the 4-year period, perceived timeliness and positive overall visit ratings increased from 53.1% to 70.5% and 56.5% to 76.5%, respectively. Perceived timeliness and positive overall visit rating peaked at a LOS of 21-30 minutes and 31-40 minutes, respectively. As the proportion of VA time increased, the positive perceptions of timeliness and overall visit ratings also increased.
Conclusion: Increasing VA time for patients resulted in improved patient experience scores, though there is a greater increase in scores for patients with a longer length of stay.
INTRODUCTION
Healthcare has embraced a continuous improvement journey to improve patient experience and health outcomes, eliminate waste, and be better stewards of resources.1,2 Lean healthcare (LH), a popular system based on the Toyota production system, has emerged as the leading strategy to eliminate waste and add value to the patient’s healthcare experience since the early 2000s.3,4
Up to 70% of hospitals in the United States use LH or similar strategies to improve outcomes and lower costs across a variety of departments within healthcare organizations.5 LH principles dichotomize processes as either value-add (VA) or non-value add (NVA) with regards to the patient.6 Processes that satisfy the patients’ needs are considered VA time whereas any processes that take time, space, or resources that do not satisfy the patients’ needs are considered NVA time.1
A 2020 systematic review found that LH eliminated waste by reducing wait times and length of stay (LOS) in ambulatory settings, but lacked evidence that LH impacted patient satisfaction.7-16 A multitude of factors can affect patient satisfaction, including wait times, LOS, humanity of care, communication, facility cleanliness, surveying methods, and cost.17,18
Total LOS and wait times have become common metrics for improvement across many ambulatory services, including emergency department and urgent care (UC) centers17,18; however, higher patient satisfaction score have been associated with better medical outcomes and patient safety measures.19-22
With urgent care being largely in suburban areas, access and convenience are leading this ambulatory care setting to be one of the fastest growing sectors in healthcare.2,23 In a 2019 survey, more than one in four children had at least one urgent care visit during the previous 12 months.24 Having an urgent care located within one’s zip code24,25 and even one visit to a UC, was associated with decreased emergency department use.25,26
Urgent care centers also provide faster time to evaluation compared with the emergency department. On average, LOS at a hospital-based pediatric urgent care (PUC) is 70 minutes.27 This would generally be longer when compared with a scheduled appointment at a primary care office; however, in the emergency department patients have an average LOS of 1-2 hours.28,29
While previous studies in an emergency room setting have demonstrated that a shorter LOS was associated with improved patient satisfaction scores, these studies did not evaluate the impact of LOS specific to the faster-paced, convenient care PUC setting.19-21 Nor have studies evaluated if the proportion of VA time influences perception of timeliness and overall satisfaction.22
This study evaluated the impact process improvements to increase the percentage of VA time in a PUC setting had on the percentage of positive perceptions for timeliness and overall rating on patient experience surveys.
METHODS
Setting and Process Improvements
We implemented multiple process improvements from July 2017 to June 2021 within three freestanding PUC centers in a midwestern metropolitan area associated with a tertiary pediatric healthcare entity. The PUC centers operate 10 hours a day, 365 days a year. Pediatricians and advanced-practice nurse practitioners staff the PUC centers and provide care for over 90,000 encounters for unscheduled, nonemergent pediatric illnesses and injuries each year.30
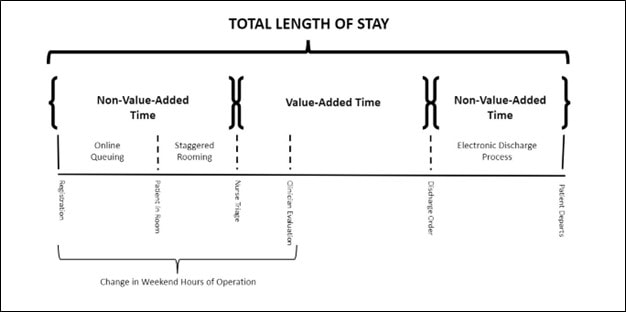
In 2016, a multidisciplinary group of PUC directors, clinicians, nurses, care assistants, and patient-access representatives completed training in LH methodology. They used process mapping to identify areas of NVA time during a patient encounter. Next, they identified interventions that could reduce the proportion of the visit considered NVA time, thereby increasing the proportion considered VA time. (See Figure 1.)
Ideally, VA time would be defined as face-to-face interaction time with a nurse or provider. However, the EMR limited the ability to obtain only face-to-face time stamps. Therefore, VA time was defined as the time between nurse triage initiation and discharge order. Interventions developed to decrease NVA time included staggered rooming, online queuing, shifting weekend hours of operation, and an electronic discharge process.
Staggered rooming
We implemented staggered rooming in June 2017. This process involved care assistants controlling the flow of patients into exam rooms so that only two to four patients were waiting in an exam room to be seen. This decreased the NVA time that patients spent waiting in the exam room and increased transparency of the expected queue families had on arrival.
Online queuing
In September 2017, we implemented an online queuing process that allowed families to reserve their spot online prior to arrival in the PUC facility. This intervention decreased NVA time families spent in the waiting room. This process allowed us to display anticipated wait times to manage family expectations.
Shifting weekend hours
After implementing online queuing, we noticed an increase in patient volumes during opening hours on the weekends, which resulted in longer LOS for clinical encounters throughout the day. To accommodate this uneven demand of service, in January 2018 we shifted the weekend hours to open earlier in the day. This allowed for a more even cadence of patients entering the unit throughout the day and decreased overall wait times in the first few hours of opening.29
Electronic discharge process
To decrease NVA time families spend waiting after the discharge order is placed, we implemented an electronic depart process initially at one PUC site in July 2018 and spread to all sites in July 2019.31 This process required families to enroll in an online patient portal to receive electronic discharge instructions.
Study Design
We performed a retrospective study of all PUC encounters discharged between July 1, 2017 and June 30, 2021 that completed a postdischarge patient experience survey. Our analysis excluded any encounters of patients that left before they were seen, those transferred or admitted, or if the encounter did not have an associated returned patient experience survey. We collected patient demographics (age, gender, race, ethnicity, documented patient language, insurance type) and time-stamp documentation from the electronic medical record. Demographics of survey respondents vs nonrespondents were obtained to determine response bias. The study (STUDY00001687) was deemed exempt under 45 CFR 46.104(d) category 4(iii) per our institutional review board.
Data collection
We measured total LOS in minutes, which we extracted from the electronic medical record encounter time stamps and defined as the duration of time from registration to the time the patient checks out from the facility. We defined VA time as the time between the start of nurse triage assessment to the discharge order (Figure 1).
LH dogma places importance on evaluating success through the lens of the consumer; therefore, we used patient experience surveys for our outcome measures.32,33
First, perception of timeliness was defined as a response of “Yes, definitely” on a 4-point Likert scale to the question “Were you seen in a timely manner?”. Second, we defined positive overall rating as a score ≥9 on a 0-10 scale for the question, “If 0 is the worst and 10 is the best, how would you rate this visit?”
Data analysis
We documented changes in median LOS, perception of timeliness, and overall rating by fiscal year. We dichotomized the data based on whether an encounter LOS was above (“longer”) or below the (“shorter”) overall median LOS for the entire study period. We then evaluated the effect increasing the proportion of VA time for the encounter had on patient experience scores for visits, stratified by shorter/longer LOS. We trended the rate of positive patient experience scores for 10-minute increments in LOS and determined the slope of the line. We used Microsoft Power BI (Version 2.99.862.0; Redmond, WA) to aggregate data and create visualizations. Data points were not reported if there were <30 survey respondents in that category.
The overall median LOS was compared between fiscal years (FY) using an unadjusted quantile regression model. Unadjusted beta-regression models were used to examine the relationship between positive patient experience scores and the 10-minute incremental LOS variable. Postestimation marginal effects were completed to determine the discrete change in patient experience for each increase in LOS interval. Beta-regression models were used to model patient experience and a categorical VA (ie, 5% interval) indicator, stratified by short/long LOS status. Select demographic and clinical characteristics were compared based on inclusion/exclusion status, with Pearson’s chi-square test used for categorical variables and the Wilcoxon rank-sum test used for continuous variables. All analyses were completed using R software (version 4.0.3; R Core Team; Vienna, Austria)
RESULTS
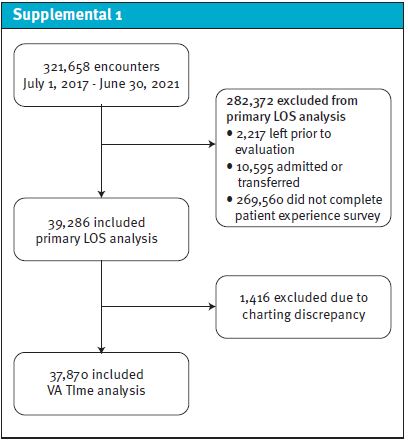
We saw 321,658 encounters across three suburban PUC centers between July 1, 2017 and June 30, 2021. Of those encounters, 39,286 (12.2%) completed a patient experience survey and were included in our primary analysis. Table 1 compares the demographics of those included and excluded in this analysis. We excluded an additional 1,416 encounters from the subanalysis of positive patient experience due to the percent VA time outside of 0% to 100% as this was likely a charting error (ie, nurse triage documentation timestamp occurred after patient was discharged (Supplemental 1).
Table 1. Encounters that Completed a Patient Experience Survey and Were Included in the Primary Analysis vs Those that Did Not Complete a Survey and Were Excluded from Analysis.
| Total encounters (n= 321,658) | Responded to survey (n=39,286) | No survey response (n=282,372) | p-value | |
| Fiscal Year—n (column %) | <0.001 | |||
| 2018 | 94,083 (29.2%) | 14,547 (37.0%) | 79,536 (28.2%) | |
| 2019 | 89,853 (27.9%) | 10,495 (26.7%) | 79,358 (28.1%) | |
| 2020 | 81,587 (25.4%) | 7,818 (19.9%) | 73,769 (26.1%) | |
| 2021 | 56,135 (17.5%) | 6,426 (16.4%) | 49,709 (17.6%) | |
| Patient age | <0.001 | |||
| <2 years | 79,483 (24.7%) | 8,534 (21.7%) | 70,949 (25.1%) | |
| 2-12 years | 195,504 (60.8%) | 24,302 (61.9%) | 171,202 (60.6%) | |
| 13+ years | 46,669 (14.5%) | 6,449 (16.4%) | 40,220 (14.2%) | |
| Unknown | 2 (0.0%) | 1 (0.0%) | 1 (0.0%) | |
| Gender | 0.006 | |||
| Female | 159,040 (49.4%) | 19,529 (49.7%) | 139,511 (49.4%) | |
| Male | 162,599 (50.6%) | 19,751 (50.3%) | 142,848 (50.6%) | |
| Unknown | 19 (0.0%) | 6 (0.0%) | 13 (0.0%) | |
| Patient Language | <0.001 | |||
| English | 310,165 (96.4%) | 37,651 (95.8%) | 272,514 (96.5%) | |
| Spanish | 7,007 (2.2%) | 1,166 (3.0%) | 5,841 (2.1%) | |
| Other | 4,482 (1.4%) | 468 (1.2%) | 4,014 (1.4%) | |
| Unknown | 4 (0.0%) | 1 (0.0%) | 3 (0.0%) | |
| Ethnicity | <0.001 | |||
| Hispanic/Latino | 40,596 (12.6%) | 4,675 (11.9%) | 35,921 (12.7%) | |
| Non-Hispanic | 278,322 (86.5%) | 34,170 (87.0%) | 244,152 (86.5%) | |
| Unknown | 2,740 (0.9%) | 441 (1.1%) | 2,299 (0.8%) | |
| Race | <0.001 | |||
| White | 216,222 (67.2%) | 27,315 (69.5%) | 188,907 (66.9%) | |
| Black | 36,552 (11.4%) | 3,927 (10.0%) | 32,625 (11.6%) | |
| Asian | 7,306 (2.3%) | 973 (2.5%) | 6,333 (2.2%) | |
| Hispanic | 24,799 (7.7%) | 3,000 (7.6%) | 21,799 (7.7%) | |
| Other | 33,116 (10.3%) | 3,492 (8.9%) | 29,624 (10.5%) | |
| Unknown/ refused | 3,663 (1.1%) | 579 (1.5%) | 3,084 (1.1%) | |
| Insurance | <0.001 | |||
| Commercial | 165,291 (51.4%) | 23,412 (59.6%) | 141,879 (50.2%) | |
| Medicaid | 127,004 (39.5%) | 12,409 (31.6%) | 114,595 (40.6%) | |
| Self-pay | 16,070 (5.0%) | 1,534 (3.9%) | 14,536 (5.1%) | |
| Other | 7,859 (2.4%) | 1,253 (3.2%) | 6,606 (2.3%) | |
| Unknown | 5,434 (1.7%) | 678 (1.7%) | 4,756 (1.7%) | |
| Length of stay—minutes median [IQR] | 77.4 [56.9, 105.0] | 74.9 [55.0, 101.0] | <0.001 |
LOS and Positive Patient Experience
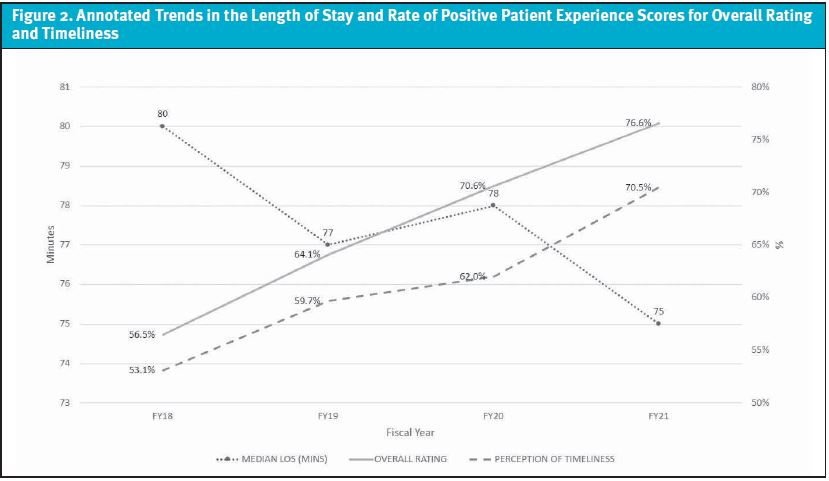
Median LOS decreased from 80 minutes in FY18 to 75 minutes in FY21 (p-value < 0.001). As LOS decreased, patient experience scores increased over time. The percentage of positive scores for both perception of timeliness and overall visit rating increased from 53.1% to 70.5% (p-value < 0.001) and 56.4% to 76.6% (p-value < 0.001), respectively. (See Figure 2.)
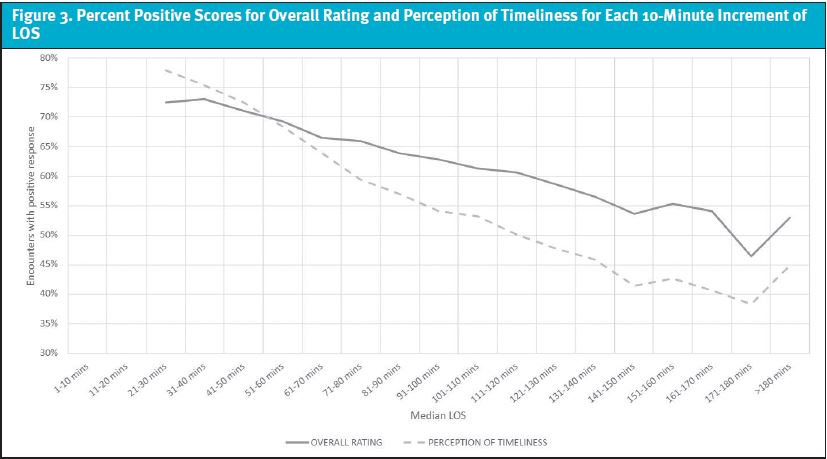
As LOS increased, the percentage of positive timeliness scores peaked at 77.9% at 21-30 minutes and then began to decline at a slope of -2.4% for each 10-minute increase in LOS (p-value<0.001). (See Figure 3.) The percentage of positive responses for overall visit rating peaked at 73.1% at 31-40 minutes and showed a -1.5% decline for each 10-minute increase in LOS thereafter (p-value <0.001).
VA Time and Positive Patient Experience
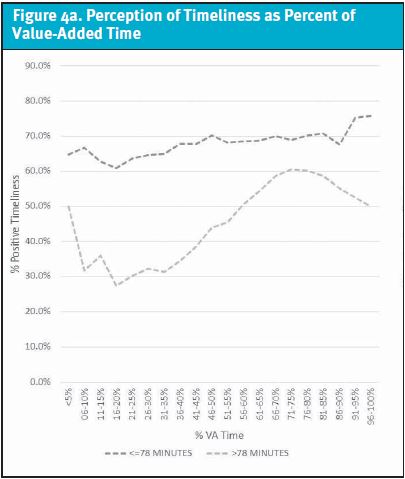
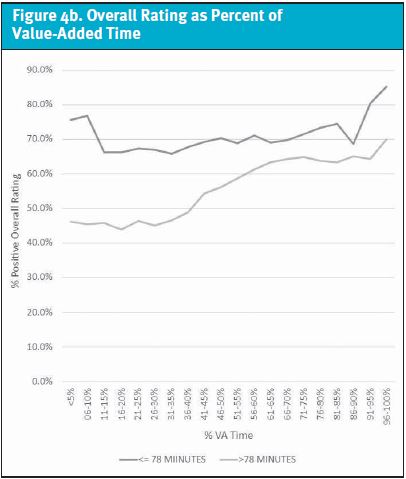
For shorter stays, each 5% increase of VA time increased the percentage of positive timeliness scores by 0.53% (p-value <0.0001) and by 1.51% for longer stays (p-value <0.0001). (See Figure 4a.) Similarly, overall visit rating increased by 0.41% for LOS ≤78 minutes (p-value=0.023) and 1.46% for LOS >78 minutes (p-value<0.001) for each 5% increase in VA time. (See Figure 4b.)
DISCUSSION
We implemented several processes that improved throughput, decreased total LOS, increased the percentage of VA time within encounters, and improved patient experience scores. Our efforts were associated with a 7.5% decrease in median LOS and a relative increase of positive patient experience scores of 33.9% for perception of timeliness and 38.4% for overall visit rating.
As the proportion of the visit that is considered VA time increased, the percentage of positive patient experience scores increased; moreover, the effect was more dramatic for encounters with durations longer than the median LOS of 78 minutes.
Our process- improvement interventions leveraged Maister’s tenets on the psychology of waiting, which calls attention to the fact that anxiety makes waits seem longer.34 Few scenarios are more anxiety-provoking than an ill or injured child. The remainder of the tenets leverage either setting expectations or improving perceptions. By increasing transparency on wait times, we were able to better manage our families’ expectations, resulting in an increase in patient experience scores despite a minimal decrease in actual median LOS.
The staggered rooming created a group waiting experience, a visible explanation for the wait time. The online queuing system allowed families to start the process right away and provided an ability to provide more certainty as to when they would be seen. This suggests that while we should continue to identify opportunities to eliminate waste and maximize efficiency, interventions that manage expectations, provide transparency, and influence perceptions of care delivery may be as effective at improving patient experience.
Our results are consistent with previous studies in the emergency department that demonstrated an inverse relationship between length of stay and patient satisfaction.35
While families have reported wait times up to an hour as acceptable in the emergency department, families in the PUC setting expect care to be more timely.2 In the PUC setting, the percentage of positive overall visit rating scores peaked at a LOS between 31-40 minutes. As LOS increased, the percentage of positive perceptions for timeliness decreased; however, the percentage of positive overall rating was resilient to increasing LOS. This suggests that timeliness was not the sole factor in determining a positive patient experience and aligns with one of the tenets on the psychology of waiting: the more valuable the service, the longer the customer will be willing to wait.34
While previous quality improvement studies have focused on decreasing LOS in the emergency department and ambulatory settings,36-40 the effect of increasing the proportion of VA time on patient experience scores has not been reported.8
Our results indicate that increasing VA time is associated with an increase in both perception of timeliness and overall visit rating regardless of LOS. For encounters where the duration of the visit is longer than the median LOS, the effect of VA time is greater. For practical purposes, when families have experienced long wait times, they perceive the visit more favorably when the provider balances the prolonged wait time with a conscious effort to increase the VA time.41
LIMITATIONS
This study was conducted in multiple metropolitan PUCs; however, the generalizability of our results may be limited.
Although patient experience surveys are offered to all families seen in the PUC who had not recently completed a survey for a service at any of the associated pediatric facilities, the respondents were a small percentage of the overall population treated in urgent care.
There were statistically significant differences in demographics and LOS between the responders and nonresponders, which may have biased the outcome measures as different socioeconomic and individual demographics can influence how families respond to a patient experience survey.
A small number of encounters with patient experience surveys were excluded due to VA time being outside the 0% to 100% range. This denotes the reliance on the human factor entering the time-mark data into the electronic medical record at the actual time of service, which may impact the accuracy of the time marks. However, we would anticipate that this would have happened randomly and should not have induced undue bias.
Additionally, there may be NVA time during the evaluation and management of an encounter we did not subtract from the measured VA time. This additional NVA time may be significant in those encounters with a longer total LOS, as those patients typically are waiting for laboratory or radiographic test results, therapeutic interventions, and/or consultations.
In patients with shorter LOS, the VA time gives a more accurate description of face-to-face time with the healthcare team.
The authors recognize that other operational or clinical processes could have affected patient perception that was not reviewed in our study. Other than the four major process improvements discussed, there was a change in hospital leadership during the study timeframe with resultant updates to our hospital’s mission.
Finally, the COVID-19 pandemic occurred at the end of fiscal year 2020 and continued through the end of the study period. The early effect of the global pandemic recognizing “healthcare heroes” saw a national increase in patient experience scores during the last half our study and may be an anomaly.42
CONCLUSION
This study adds to the body of evidence that the inverse relationship between LOS and patient experience ratings also apply in a PUC setting. Process improvements that manage patient expectations of wait time and increase the proportion of the encounter that is considered VA time can have a positive effect on patient experience scores despite a minimal effect on actual LOS.
REFERENCES
- Bercaw R. Taking improvement from the assembly line to healthcare: the application of lean within the healthcare industry. Productivity Press; 2021.
- Mehrotra A. The convenience revolution for treatment of low-acuity conditions. JAMA. 2013;310(1):35-36.
- Brandao de Souza L. Trends and approaches in lean healthcare. Leadership in health services. 2009;22(2):121-139.
- Costa LBM, Godinho Filho M. Lean healthcare: review, classification and analysis of literature. Production Planning & Control. 2016;27(10):823-836.
- Shortell SM, Blodgett JC, Rundall TG, Kralovec P. Use of lean and related transformational performance improvement systems in hospitals in the United States: results from a national survey. Jt Comm J Qual Patient Saf. 2018;44(10):574-582.
- Cohen RI. Lean methodology in health care. Chest. 2018;154(6):1448-1454.
- Fustino NJ, Moore P, Viers S, Cheyne K. Improving patient experience of care providers in a multispecialty ambulatory pediatrics practice. Clin Pediatr (Phila). 2019;58(1):50-59.
- Tlapa D, Zepeda-Lugo CA, Tortorella GL, et al. Effects of lean healthcare on patient flow: a systematic review. Value Health. 2020;23(2):260-273.
- Manary MP, Boulding W, Staelin R, Glickman SW. The patient experience and health outcomes. N Engl J Med. 2013;368(3):201-203.
- Jha AK, Orav EJ, Zheng J, Epstein AM. Patients’ perception of hospital care in the United States. N Engl J Med. 2008;359(18):1921-1931.
- Doyle C, Lennox L, Bell D. A systematic review of evidence on the links between patient experience and clinical safety and effectiveness. BMJ Open. 2013;3(1):e001570
- Trzeciak S, Gaughan JP, Bosire J, Mazzarelli AJ. Association between Medicare summary star ratings for patient experience and clinical outcomes in US hospitals. J Pt Exp. 2016;3(1):6-9.
- Tsai TC, Orav EJ, Jha AK. Patient satisfaction and quality of surgical care in US hospitals. Ann Surg. Jan 2015;261(1):2-8.
- Hojat M, Louis DZ, Markham FW, et al. Physicians’ empathy and clinical outcomes for diabetic patients. Acad Med. Mar 2011;86(3):359-364.
- Kelley JM, Kraft-Todd G, Schapira L, et al. The influence of the patient-clinician relationship on healthcare outcomes: a systematic review and meta-analysis of randomized controlled trials. PLoS One. 2014;9(4):e94207.
- Trout A, Magnusson AR, Hedges JR. Patient satisfaction investigations and the emergency department: what does the literature say? Acad Emerg Med. 2000;7(6):695-709.
- Liu L, Fang J. Study on potential factors of patient satisfaction: based on exploratory factor analysis. Patient Prefer Adherence. 2019;13:1983-1994.
- Sonis JD, Aaronson EL, Lee RY, et al. Emergency department patient experience: a systematic review of the literature. J Patient Exp. 2018;5(2):101-106.
- Bursch B, Beezy J, Shaw R. Emergency department satisfaction: what matters most? Ann Emerg Med. Mar 1993;22(3):586-591.
- Hansagi H, Carlsson B, Brismar B. The urgency of care need and patient satisfaction at a hospital emergency department. Health Care Manage Rev. 1992;17(2):71-75.
- Watson WT, Marshall ES, Fosbinder D. Elderly patients’ perceptions of care in the emergency department. J Emerg Nurs. 1999;25(2):88-92.
- Thompson DA, Yarnold PR, Williams DR, Adams SL. Effects of actual waiting time, perceived waiting time, information delivery, and expressive quality on patient satisfaction in the emergency department. Ann Emerg Med. 1996;28(6):657-65.
- FAIR Health. A new view of place of service trends and medical pricing FH healthcare indicators and FH medical price index. 2018. Available at: https://s3.amazonaws.com/media2.fairhealth.org/whitepaper/asset/FH%20Medical%20Price%20Index%20and%20FH%20Healthcare%20Indicators–whitepaper.pdf. Accessed June 11, 2020.
- Black LI, Zablotsky B. Urgent care center and retail health clinic utilization among children: United States, 2019. US Department of Health and Human Services. Hyattsville MD; 2019 (12). Available at: https://www.cdc.gov/nchs/products/index.htm. Accessed December 22, 2020.
- Allen L, Cummings JR, Hockenberry JM. The impact of urgent care centers on nonemergent emergency department visits. Health Serv Res. 2021;56(4):721-730.
- Merritt B, Naamon E, Morris SA. The influence of an urgent care center on the frequency of ED visits in an urban hospital setting. Am J Emerg Med. 2000;18(2):123-125.
- Montalbano A ME, Lee B. Organization for Urgent Care Health 2017 Data. 2018. Available at: https://www2.urgentcarepeds.org/members/OUCH-2017-Infographic.pdf.
- Spechbach H, Rochat J, Gaspoz JM, et al. Patients’ time perception in the waiting room of an ambulatory emergency unit: a cross-sectional study. BMC Emerg Med. 2019;19(1):41.
- Patel A, Johnson J, Lee BR, Montalbano A. More timely care: effect of online queuing vs change in hours of operation on hourly arrival volumes. A practice management reflection. J Urgent Care Med. 2021;15(9):25-30.
- Children’s Mercy Hospital. Children’s Mercy Annual Report 2017. 2017. Children’s Mercy annual Reports. 12. Available at: https://scholarlyexchange.childrensmercy.org/cmh-annual-reports/12 Accessed December 7, 2021.
- Nedved A, Wooster J, Lee B, et al. Using an electronic discharge process to improve patient experience and timeliness in a pediatric urgent care setting. Patient Educ Couns. 2021;105(3):781-785.
- Jenkinson C, Coulter A, Bruster S, et al. Patients’ experiences and satisfaction with health care: results of a questionnaire study of specific aspects of care. Qual Saf Health Care. 2002;11(4):335-339.
- Jenkinson C, Coulter A, Reeves R, et al. Properties of the Picker patient experience questionnaire in a randomized controlled trial of long versus short form survey instruments. J Public Health Med. 2003;25(3):197-201.
- Maister DH. The psychology of waiting lines. Available at: https://davidmaister.com/articles/the-psychology-of-waiting-lines. Accessed January 11, 2023.
- Chang AM, Lin A, Fu R, et al. Associations of emergency department length of stay with publicly reported quality-of-care measures. Acad Emerg Med. Feb 2017;24(2):246-250.
- Mazzocato P, Holden RJ, Brommels M, et al. How does lean work in emergency care? A case study of a lean-inspired intervention at the Astrid Lindgren Children’s hospital, Stockholm, Sweden. BMC Health Serv Res. 2012;12:28.
- Rutman L, Stone K, Reid J, et al. Improving patient flow using lean methodology: an emergency medicine experience. Current Treatment Options in Pediatrics. 2015;1(4):359-371.
- Weaver A, Greeno CG, Goughler DH, et al. The impact of system level factors on treatment timeliness: utilizing the Toyota Production System to implement direct intake scheduling in a semi-rural community mental health clinic. J Behav Health Serv Res. 2013;40(3):294-305.
- Bost N, Crilly J, Wallen K. The impact of a flow strategy for patients who presented to an Australian emergency department with a mental health illness. Int Emerg Nurs. 2015;23(4):265-273.
- Wiler JL, Bookman K, Birznieks DB, et al. Rapid process optimization. Am J Med Qual. 2017;32(2):172-177.
- Lidgett CD. Improving the patient experience through a commit to sit service excellence initiative. Patient Experience Journal. 2016;3(2):67-72.
- DeLaney M, Wood L. Health care heroes? J Am Coll Emerg Phys Open. 2021;2(1).
Manuscript submitted October 4, 2022; accepted October 12, 2022.
Author affiliations: Aimy Patel MD, Division of Urgent Care, Children’s Mercy Kansas City; Department of Pediatrics, University of Missouri-Kansas City School of Medicine. Brian R. Lee, MPH, PhD, Health Services and Outcomes Research, Children’s Mercy Kansas City; University of Missouri-Kansas City School of Medicine. Amanda Montalbano, MD MPHc, Division of Urgent Care, Children’s Mercy Kansas City; Department of Pediatrics, University of Missouri-Kansas City School of Medicine. Amanda Nedved MD, Division of Urgent Care, Children’s Mercy Kansas City; Department of Pediatrics, University of Missouri-Kansas City School of Medicine. This research did not receive any specific grant from funding agencies in the public, commercial, or not-for-profit sectors.
Read More
- A Comparison Of Chief Complaints, Specific Diagnoses, And Demographics Of Pediatric Urgent Care Visits Before And During The COVID- 19 Pandemic: A Retrospective Study
- Learner Presence Does Not Negatively Impact Patient Experience In Pediatric Urgent Care
- Dispelling Physician Myths About The Patient Experience
