
Published on
Download the article PDF: Urgent Care Practice Varies More By Provider On Duty Than By Center Payer Or Patient
Urgent Message: Urgent care operators may find practice variation in testing, imaging, referral, and coding among clinicians working in the same clinic. According to this data analysis, the reason for variation ultimately comes down to the decision making of the individual clinician rather than infrastructure, payer, or patient population.
Alan A. Ayers, MBA, MAcc
Keywords: urgent care practice variation; provider variation; clinical practice patterns; diagnostic testing; referral patterns; evaluation and management coding; clinician performance
Walk into any 2 urgent care centers operating under the same banner, and you would expect 2 patients with the same complaint to receive the same care. Yet, they often do not. One gets a strep test, and the other doesn’t. One visit is billed for an evaluation and management (E/M) level 3, but the other a level 4. Two decades of effort have gone into standardizing the patient experience across urgent care, from workflows to staff training to software, but the question of why similar patients still get different workups remains.
When comparing practice variation between urgent care visits, there are several variables to consider, such as:
- Characteristics of the patient population
- Capabilities of the specific clinic
- Policies and infrastructure of the parent company
- Decision making of the individual provider
For example, an older or sicker population legitimately requires a more time-consuming workup. A clinic without an x-ray machine must refer patients elsewhere for imaging. Or an individual provider may require a certain test before prescribing a certain medication while another provider treats presumptively.
Analyzing Sources Of Variation
In July 2026, Urgent Care Consultants analyzed 13.4 million urgent care visits from the Experity network, which processes roughly 3 in 10 urgent care visits nationally. The extract covered January–June 2026 across nearly 3,000 clinics, more than 7,500 providers, and 17 payer classes, generating 13.7 million E/M codes. Test and training accounts, inactive sites, and low volume providers were excluded. Mixed-effects models then partitioned the differences in 7 practice indicators across 3 levels: the company; the individual clinic; and the individual provider. Payer type, patient age, sex, and race were examined separately.
Based on the analysis, the largest practice differences were observed between individual providers working in the same clinic. Brand, payer, and patient demographics accounted for very little of the practice variation in the indicators that depend on clinical judgment. Decision making of the individual provider was a more telling variable.
Testing Capability Is a Corporate Decision
Some practice indicators depend mostly on what a clinic is equipped to do. Whether a patient can get an x-ray or a definitive strep test, for example, comes down to equipment, laboratory certification, and support staffing. And these are corporate decisions, not bedside ones. The data shows company and site together account for roughly 80% of the differences in lab testing and radiology rates and about three-quarters of the differences in procedure codes per visit (Figure 1).
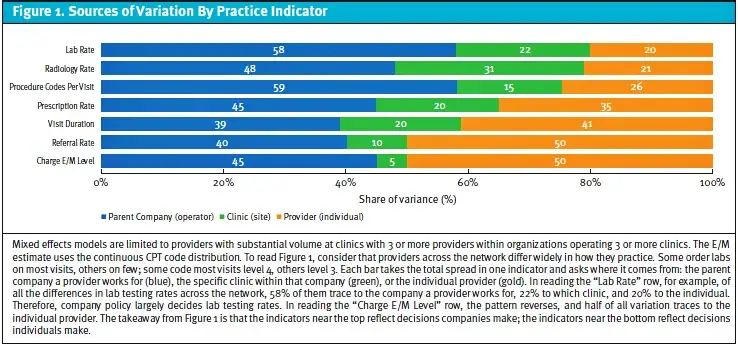
One exception stands out. Inside urgent care networks where most locations have a regular flow of imaging volume, a few individual clinics logged no radiology at all. This pattern is unlikely to reflect clinical judgment. Instead, a more probable explanation is an out-of-service machine or an unfilled radiologic technologist position. X-ray availability is the only finding in this dataset attributable primarily to the individual site.
Ordering Behavior Resolves To Individual Provider
In analyzing decisions made inside the exam room, half of the variation in E/M coding intensity is attributable to the individual provider; the same is true of referral rates. Meanwhile, more than 40% of visit duration variation can be traced to the provider as well.
The absolute gaps are large. At a typical clinic staffed by 5 or more providers, those providers coding at the highest level and those coding at the lowest level are 33 percentage points apart when examining the share of E/M visits billed at level 4 or 5. The clinician who orders the most imaging orders x-rays at nearly 3 times the rate of the provider with the least imaging orders, while drawing from the same population. Lab testing rates differ by 18 percentage points between colleagues in the same building.
Provider credentials (physician, nurse practitioner, physician assistant/associate) explain little of this practice variation. Once the analysis accounts for work location, physicians and advanced practice providers order, refer, and code at nearly identical rates. The differences occur between individual clinicians, not between clinician types.
Individual ordering patterns of clinicians also appear stable across their different patient types. A provider’s testing rate with male patients closely matches that same provider’s rate with female patients. Providers who spend more time with a particular age group tend to spend more time with all of their patients. In other words, ordering intensity appears to function more as an individual characteristic than as a response to the presenting patient.
Payer Type Explains Little
Many operators assume that insurance type drives coding or testing, but the data does not support this. Among conventional insurance types, the patient’s health plan accounts for less than 1% of the variation in coding. Medicare visits show coding patterns similar to commercial visits within the same clinics. When analyzing lab and radiology orders, Aetna, Blue Cross Blue Shield, Cigna, and UnitedHealthcare patients cluster together tightly enough that the differences among them carry no operational consequence (Figure 2).
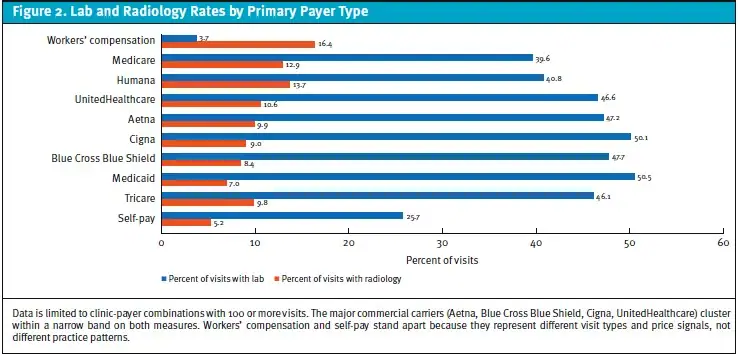
Where payer type does appear to matter, visit composition rather than the payer itself is the more likely driver. For example, workers’ compensation involves more injury care, heavy on imaging and light on labs. And occupational medicine is largely composed of physicals and drug screens. These differences appear to reflect the different composition of needs rather than different practice patterns.
Self-pay is another exception. Within the same clinics, cash-paying patients received roughly half as many labs and 40% less imaging. Their visits were also coded about a third of a level lower. This variation can be found even among established patients. This may indicate that cash patients arrive with simpler complaints, or providers may purposefully order less when the patient is paying out of pocket.
Patient Mix Does Not Account For Gaps
The obvious alternative explanation to such practice variation is case mix. Yet patient age, sex, and race combined account for less than 3% of the visit-level variation in any indicator.
Age by itself does produce clinical variation. For example, the analysis found that imaging rates climb roughly fivefold from toddlers to seniors, and lab testing peaks in the school-age years (when streptococcal pharyngitis is most common).
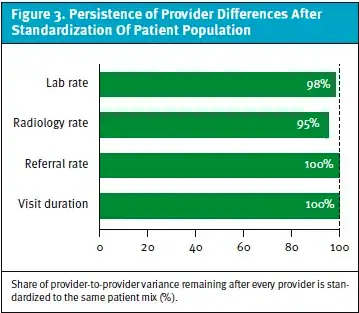
To account for these differences in case mix, direct standardization can provide a sharper test of provider variation. In a detailed analysis among 4,095 providers, each provider’s rates (ie, labs, radiology, referral, and visit duration) were recalculated as though every provider treated an identical patient population, with the comparison populations matched on age and sex. The result: 95%–100% of the provider-to-provider variation persisted even after the standardization adjustment (Figure 3).
Implications For Operators
These findings suggest that operational standardization may be largely succeeding, so an operator seeking to improve practice variation metrics might look to focus on provider behavior. This analysis establishes that practice differences exist; it cannot establish which part of the range represents better medicine.
The various indicators each call for a different response:
- Standardize. For situations in which there is 1 defensible standard—such as coding accuracy, documentation, and charge capture—standardize outright. A 33-point coding spread within a single clinic is a training and compliance problem more than it is anything else, and it represents both an operational improvement opportunity and potential audit exposure that could result in denied claims and lost revenue.
- Manage the extremes. Where genuine clinical judgment is involved, manage the extremes rather than the average. Consider showing every provider case-mix-adjusted numbers alongside those of their clinic colleagues and ask outliers at both ends to share their reasoning for why they do or do not order labs or imaging, for example. The 2025 Cochrane review of audit and feedback found larger effects when data was used to measure the individual clinician rather than the team or organization and when performance was benchmarked against top peers.1 In a randomized trial across 47 primary care practices, monthly emails that shared data comparing individual clinicians to top performers reduced inappropriate antibiotic prescribing.2
- Leave the middle alone. Moving a provider from the 55th percentile to the 60th percentile accomplishes little and spends resources better reserved for the genuine outliers.
Clinic-level dashboards and provider-level dashboards should be evaluated because a site’s average may conceal precisely the variation that needs to be visible in order to improve operations. New hires should be measured within their first 90 days, since practice patterns have more to do with the provider than the job. And credentials should not be used as a proxy for practice pattern.
For individual providers, the implication of practice pattern analysis and/or comparison may be uncomfortable, especially when variation appears to be largely a personal pattern and neither the insurer nor the patient population is driving it. Providers who want to improve should ask for their own practice pattern numbers. A clinician who is ordering imaging at three times a colleague’s rate in the same clinic should be able to say why, and an inability to answer is often a conversation worth having.
While the urgent care industry has spent 2 decades successfully standardizing the physical clinic, the next frontier of quality, compliance, and margin improvement largely depends on measuring and managing individual provider behavior.
References
- Ivers N, Yogasingam S, Lacroix M, et al. Audit and feedback: effects on professional practice. Cochrane Database Syst Rev. 2025;(3):CD000259.
- Meeker D, Linder JA, Fox CR, et al. Effect of behavioral interventions on inappropriate antibiotic prescribing among primary care practices: a randomized clinical trial. JAMA. 2016;315(6):562-570.
