Published on
Differential Diagnosis
- Hyperkalemia
- Myocardial infarction with hyperacute T waves
- Myocarditis
- Hypokalemia
- Brugada syndrome
Diagnosis
This patient was diagnosed with myocardial infarction with hyperacute T waves.
ECG Analysis
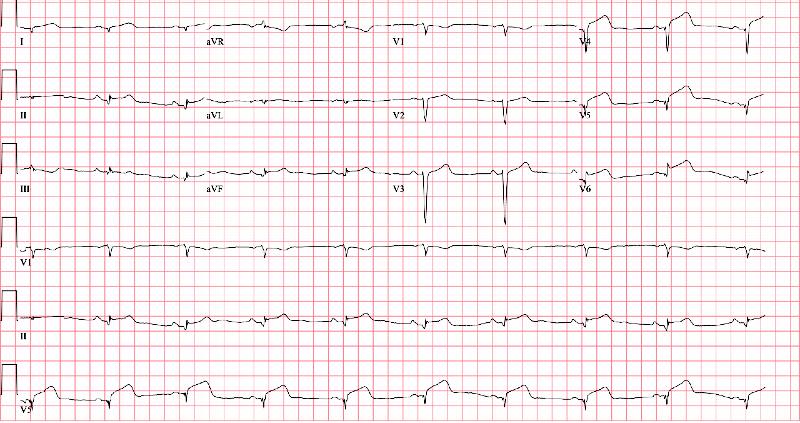
This ECG shows sinus rhythm with a rate of 66 bpm and large T waves in the inferolateral leads. The T waves in the inferolateral leads are relatively large, broad-based, and symmetric. While the T waves may not initially appear large in terms of absolute amplitude, when compared with the amplitude of the QRS complex they are as large (leads V5 and V6) or larger (leads V4 and II).
Electrocardiographic findings of ischemia include hyperacute T waves, T wave inversions, ST-changes, and Q waves (Figure 2).
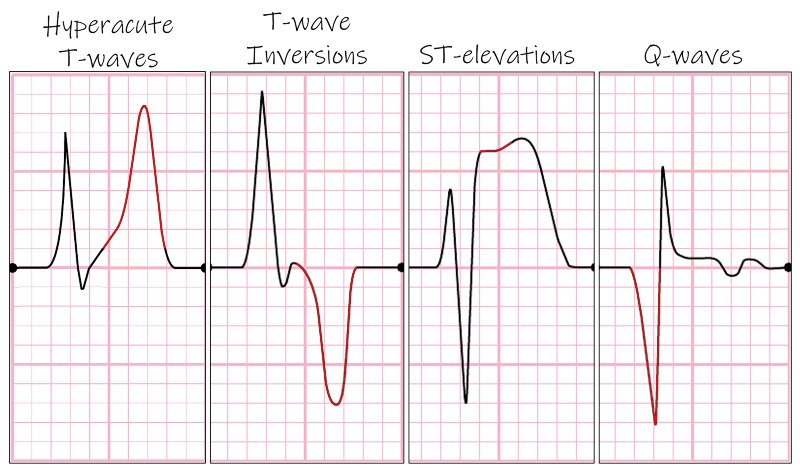
Hyperacute T waves are one of the earliest electrocardiographic findings in acute ischemia.1 They tend to occur within the first 30 minutes of acute occlusion and precede ST-segment elevation.2 They are more easily identified when a previous ECG is available for comparison.
Note that hyperacute T waves may not be large in terms of absolute amplitude, but are considered hyperacute if their amplitude exceeds that of the QRS complex (Figure 2). Additionally, when preceding T wave inversions are present, hyperacute T waves may become upright and appear normal—a phenomenon referred to as pseudonormalization.1,3
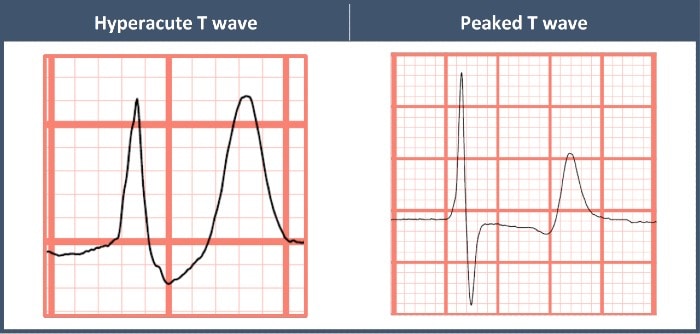
While other differential considerations exist, it is most important to differentiate hyperacute T waves from peaked T waves of hyperkalemia. The peaked T waves of hyperkalemia tend to be more narrow-based with a pointed peak, as opposed to the broad base and rounded peak of hyperacute T waves (Figure 3).
While myocarditis can cause hyperacute T waves, they do not tend to have a focal distribution. Hypokalemia can cause a prolonged QT interval by way of delaying repolarization. Brugada syndrome is a sodium channelopathy with a characteristic ECG pattern (pseudo-right bundle branch block pattern with down sloping ST segment elevation in V1 and/or V2) and an increased risk of sudden cardiac death, in the absence of gross structural heart disease. T
he patient in this case had a repeat ECG that revealed evolving ST-segment elevation in the lateral precordial leads (Figure 4). She was taken for emergent catheterization, which revealed a mid-left anterior descending artery occlusion.
Learnings/What to Look for
- Hyperacute T waves are early electrocardiographic findings of acute ischemia
- Look for large, broad-based, and symmetric T waves which exceed the amplitude of the QRS complex
Pearls for Initial Management
- When hyperacute T waves are encountered, immediate transfer to a percutaneous coronary intervention-capable facility is indicated
- Serial ECGs can help secure the diagnosis of myocardial infarction, however, transfer should not be delayed
References
- Goldberger AL. Hyperacute T waves revisited. Am Heart J. 1982;104(4):888-890.
- Graham GK, Laforet EG. An electrocardiographic and morphologic study of changes following ligation of the left coronary artery in human beings: a report of two cases. Am Heart J. 1952;43(1):42-52.
- de Zwaan C, Bär FW, Wellens HJ. Characteristic electrocardiographic pattern indicating a critical stenosis high in left anterior descending coronary artery in patients admitted because of impending myocardial infarction. Am Heart J. 1982;103(4):730-736.