Published on
Urgent message: Assessing the true cost per patient is key to determining which pricing model will generate the most revenue for an urgent care center.
JORDAN TODD RICE, MD
A cost-per-patient analysis may not work for every urgent care center owner, but this article is intended to give JUCM readers the basic tools they need to understand the formulas. It can also serve as a baseline for discussions with urgent care center staff, executives, managers, clinicians, and owners.
The goal of the exercise is to help urgent care providers better understand key elements of patient costs so they can determine which pricing model will best serve their organizations, be they for-profit, nonprofit, a single urgent care center or a practice with multiple locations.
How do operators of urgent care centers truly break down the cost for providing care to a single patient for primary care, urgent care or Workers’ Compensation services?
- How can the operator of an urgent care center do a true cost/benefit analysis to find out if it makes sense to switch to a single payment from payors rather than traditional fee-for-service reimbursement?
- How can and will paperless and digital systems affect the answers to the previous two questions?
Overcoming Accounting Obstacles
One of the biggest challenges in calculating cost per patient is getting information from an urgent care center’s accounting and practice management systems. This is the most difficult task because such systems are great for generating information about pricing and revenue but not set up to provide costs, unless the Relative Value Unit (RVU) option is switched on. Some providers thought that the advent of all-in-one systems and single databases combing practice management (billing, scheduling, claims follow-up, etc.) and an electronic medical record would make the task easy to accomplish. In fact, automation helps practices do better charge capture, speeds up patient visits (after the normal 3- to 6-month learning curve for the switch from paper to paperless) and may even automate coding. It does not, however, compute the true cost per patient.
The other obstacle is the accounting program. Virtually every transaction in every category can be seen in an urgent care practice’s Chart of Accounts, but calculating the cost of each transaction is not as easy as you might think. For example, if your practice has a 401 (k) plan or your employees pay a portion of their health insurance, is that a true “cost” that needs to be factored into the computation of average cost?
Finally, an urgent care practice must be able to differentiate types of payors and services. For example, if your practice is a hybrid that provides both primary care and urgent care services, payors typically pay the same amount regardless of the type of visit. The main differentiators for most states and payors are factors such as the type of provider (some payors discount a physician extender visit by as much as 15%), use of “s” codes for a particular facility (fee-for-service or global fee) and whether a service was rendered “after hours” compared with the hours of an average practice. All of these factors affect reimbursement and cost, assuming that physician extenders are paid less than MDs and DOs. Even the place of service can affect reimbursement, but it usually does not impact cost. The same is true for treating Workers’ Compensation cases or providing occupational medicine services. The reimbursement levels may be higher or lower than those for a non-work-related injury, but the cost should be relatively similar for treating a 10-cm laceration, an aggravated left ankle sprain, or carpal tunnel syndrome, which is now becoming more and more common outside of the workplace because of the advent of home computers, pads, tablets, and even smartphones.
Thus we need to focus on cost only and in this case we will look across the board. Table 1 is a typical chart of accounts for an urgent care practice by category.
Your urgent care practice may have more or less accounts, but the ones listed are typical whether you have one office or 50.
For simplicity, let’s assume that for June 2011, the total for the accounts shown in Table 1 was $100,000. In a very unsophisticated model, we would simply take the number of patients for the month and divide that into $100,000 to get the cost per patient. If the practice saw 50 patients per day for 30 days in June, the total number of patients seen that month would have been 1,500. The cost per patient, then, would be $66.66 ($100,000 divided by 1,500). Net revenue of $120,000 from the 1,500 patients (understanding that most billings would be collected in June, some in July, and the remainder in August) would result in net profit of $20,000.
The collected amount per patient would be $80 and the profit per patient, in our simplistic model, would be $14.34. Continuing with our simplistic example, if a payor were to offer the practice a global fee of $90 per patient, which would typically encompass all services, including on-site laboratory, x-ray, electrocardiography (ECG), spirometry and most other patient costs, the practice would then receive a profit of $24.34 per patient. That is one reason that practices receiving global fees use digital technology for x-rays, ECG, and spirometry and send most laboratory work out to be processed. There are also savings to be had on the billing and collection side because global fees don’t get rejected, don’t have to be re-filed, and co-pays are received at the time of service, so there is little patient follow-up in terms of collections.
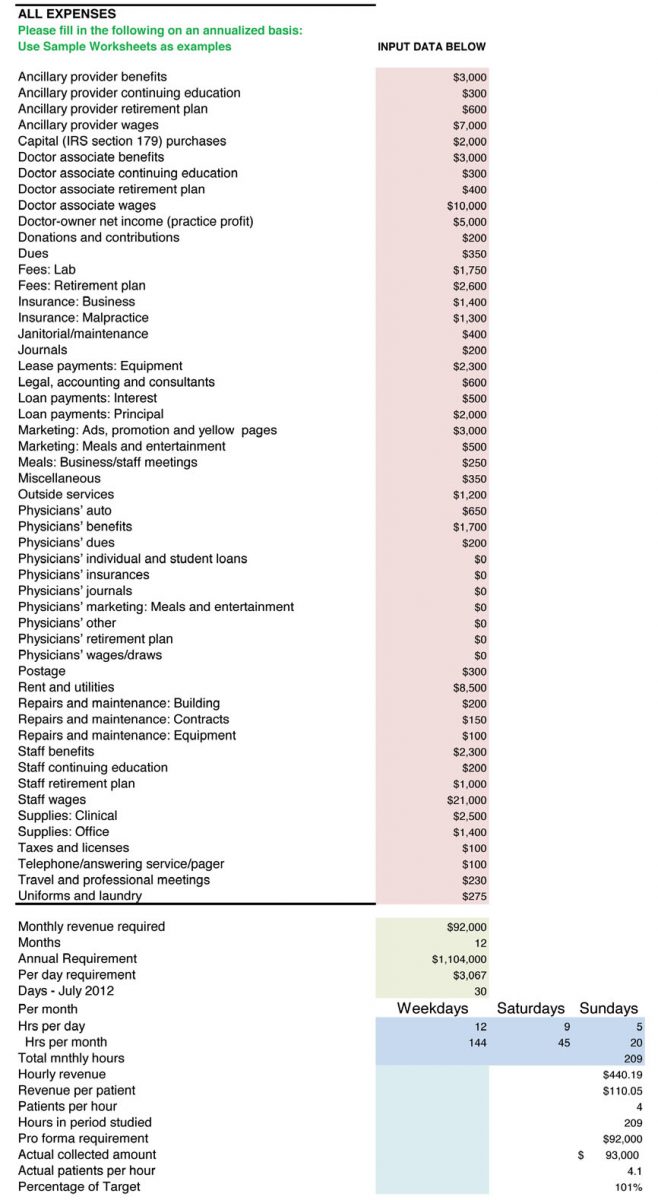
Table 1. Chart of Accounts for an Urgent Care Practice by Category |
||
ALL EXPENSES
|
|
|
Real-World Complications
Why, then, do simple cost-per-patient calculations not work in the real world? The factors involved are myriad, some which we’ve already discussed. One issue is how payroll is processed. In a traditional medical model, employees and clinicians are paid every 2 weeks. Some urgent care practices pay employees weekly, whereas others pay twice a month, and others even pay clinicians daily.
Clearly, when employees are paid every 2 weeks, there will be three pay periods in several months every year, which skews costs tremendously. Also, many insurance premiums are paid quarterly, semi-annually or even annually. That, too, affects month-to-month costs. Other factors include benefits payments, such as 401 (k) or retirement contributions, which may happen every pay period, monthly, or annually. Utility, water, sewer, and other costs also fluctuate from month to month. In Maine and Oregon, heating costs may sky rocket in mid-winter, whereas Arizona and Florida may have high cooling costs from mid-spring to mid-fall. Water and sewer costs tend to fluctuate less, but even they can go up and down. Therefore, it might make sense to do computations for your urgent care practice using quarterly, semi-annually, or even annual numbers.
If our model urgent care center has $1.2 million in true costs and 18,000 patients, the cost per patient would be the same: $66.66. But what if the center’s costs were actually $1.4 million and it had only 17,000 patients? Now the cost zooms to $82.35 per patient. Conversely, if the center only had $1 million in costs and 20,000 patients, the cost per patient would be only $50. Again, ANY additional revenues above this would be profits (or surplus for non-profit urgent care centers).
Now, let’s do some addition and subtraction from revenues for your urgent care center. Do you sell products for weight loss or durable medical equipment, or do your physicians dispense drugs? If so, those services usually are not paid by fee-for-services or global contracts. Laboratory services and x-rays typically are included in a global fee, but they usually are separate fees for a payor. Do you bill separately for them? The same question applies to Healthcare Common Procedure Coding System items, which are reimbursed and may be a “carve out” paid in addition to a global fee, depending on the individual contract. Cash-only services such as allergy testing, home sleep studies (elective), Holter or event monitoring are revenue. But their costs should be separated from the equation to compare fee-for-service and global fees and truly understand your actual cost per patient.
Understanding a Cost Benefit Analysis Spreadsheet
Next, let’s look at how a cost benefit analysis spreadsheet works. A typical one that includes all costs is available in the Resources section of UCA’s Members Only portal, Uconnect (http://uconnect.ucaoa.org), and can be downloaded for free. A screenshot of what typical data entry looks like is shown in Figure 1.
Please note that annualized numbers were used in our example for the reasons we previously mentioned. There are too many expenses that are not paid on a monthly basis, and payroll can skew the numbers from month to month.
What is key is to understand that each provider uses different resources, some of which are reimbursed and some are not. Once again, x-rays could be a profitable venture, but you have to understand the true cost of each x-ray. What is the cost of the unit? Is it leased or purchased? How much developer or fixer does it take if you use plain film for 100 or 1,000 x-rays? Is there a maintenance contract on the development unit? How about on the x-ray tube and collimator?
What cost benefit analysis does is permit the operator of an urgent care center operator to know the exact cost per x-ray, based on ALL costs against ALL revenues. In fact, I have worked with owners of urgent care centers who insisted they made money with a particular payor on a three-view ankle x-ray. But when we looked at all costs, including the cost for the room (rented or owned facility), personnel and over-reads if required, many times those x-rays were costing money not producing revenue. Even digital units have costs associated with them other than just the lease or amortized purchase price, such as the price of replacement cassettes, DVDs, maintenance, and replacement tubes.
The Impact of Variation in Reimbursement
The hardest part of determining cost per patient is factoring into the equation varying reimbursements. Unless your urgent care center accepts cash only, you may be receiving 100 different reimbursements for a three-view ankle x-ray. Medicare, Medicaid, Indian Health Service, Tri-Care and some Federally Qualified Health Center fees are all under the Centers for Medicare & Medicaid Services (CMS) umbrella, but each will have a different reimbursement level. And even that number can be affected by the clinician on duty and whether that individual was a physician extender or a physician, for whom discounts of between 10% and 15% might apply. Figure 2 illustrates this computation, focusing on one insurance company.
For our example, we used fictitious numbers and a fictitious payor and chose an arbitrary reimbursement of $35 for a three-view ankle x-ray for Delta employee. From there, we included all costs involved with taking three x-rays. Note that we added every possible cost. Most are inputted as an annual cost and then we worked backward to the cost per x-ray. We can do this working off the annual number or the monthly number. The spreadsheet includes ALL costs for the facility and takes into consideration the total amount of space for x-rays, including the development room, x-ray storage, x-ray room, and operator area. If you pay for over-reads and they are not reimbursed separately or directly by a payor, then that needs to be included. We added all costs associated with the x-ray unit (assuming a lease, in this case), such as maintenance, fixer, developer, film, and any other direct costs. We also added in 15% (every center will be different) for billing and administration to collect and bill for the service. So, after looking at our sample $35 payment and subtracting these expenses, we came out with a profit of $1.64 per three-view ankle x-ray for this particular insurance company.
The same cost can be used when negotiating global fees. You simply need to look at the total number of x-rays you do for that particular payor over a period of time (1 year is safe) and interpolate the same costs minus some administration and billing, because they will be lower. If you receive a global fee of $150, for example, and one out of three patients has an x-ray and the average cost of that x-ray is $33.36, that equals a cost of $11.12 per patient under the global fee. This same calculation can be done for all payors and all x-rays your center offers and for which it bills. This is true of in-house laboratories.
A lot of work? Absolutely! There is no easy way to do a cost benefit analysis. It takes time and effort and requires a complete knowledge of true costs and actual reimbursements net of any write-offs, charge-offs, collection fees, and any other factors that will affect the actual cash that goes into the center’s bank account.
Understanding RBRVS
Now we turn to Resource-Based Relative Value Units (RBRVS). Why are these helpful to your practice, if your practice management system allows you to use them? This is a neutral system used by CMS, HMOs, and many payors to determine how much money providers should be paid. All procedures (CPTs) are assigned a base value, which is influenced by three factors: physician work (52%), practice expense (44%), and malpractice expense (4%). The value for a particular CPT code is then further adjusted by a geographic factor because it clearly costs more to deliver services in New York and San Francisco than it would in small towns where there are no physician shortages. And finally, there is an annual conversion factor.
A debate about the issue of payment for effort-based medicine versus outcomes-based medicine is beyond the scope of this article. Reimbursement for urgent care services traditionally has been done based on our efforts and not the actual outcomes because urgent care providers usually do little follow up and are the largest referral source in all of medicine, save the emergency department. An argument can be made for reimbursing hybrid urgent care centers for outcomes-based medicine, but the focus of this article is understanding costs. And costs based on RBRVS can be a helpful indicator of what it should cost to provide a particular procedure coded via CPT for conditions from urinary tract infection, to ankle sprain, to upper respiratory infection.
Weighing Fee-for-Service Versus Global Fees
Once you understand the cost per patient for your urgent care center, you can start evaluating whether fee-for-service is better than global fees on a payor-by-payor basis. In other words, the center will have to absorb the cost per x-ray, which will ONLY be affected on the global fee basis (because it is part of the global fee), but the actual cost per x-ray to the center should be a bit lower because there is less administration and the payment is stable from patient to patient. Yes, the comparison between fee-for-service and global fees is apples to organs, but in the end, the issue is which generates more profit or surplus (for non-profits). This article has not addressed hospital-based centers that have a facility fee and professional component, because a global fee for both typically is precluded by regulatory issues at the state and federal level. Physicians employed by a hospital-owned center may want to consider comparing global fees with fee for service. Again, such calculations can take a lot of time and one center may have a global fee with Medicaid but a fee-for-service arrangement with Blue Cross Blue Shield, for example. However, without calculating the true cost per patient, no urgent care center can be in a position to properly to make a case that an insurance company or CMS is underpaying for its providers’ services.
This primer offers basic tools for starting the process of identifying your urgent care center’s cost per patient. More information is available from the following resources to help providers further refine the process:
- http://www.sjsu.edu/faculty/watkins/cba.htm
- http://management.about.com/cs/money/a/CostBenefit.htm
- http://www.mindtools.com/pages/article/newTED_08.htm
- http://www.archives.gov/federal-register/publications/faqs.html
- http://www.physicianpractice.com/rvu/content/article/1462168/1867117