Published on
Download the article PDF: Improving Chart Closure Time In A Pediatric Urgent Care Setting
Urgent Message: Quality improvement projects can increase the percentage of charts closed within 1 hour of patient discharge at pediatric urgent and express care locations to ensure timely documentation.
Key Words: Electronic Health Records, Documentation, Pediatrics, Ambulatory Care, Patient Safety, Quality Improvement
Kileen Fernandez, MS, APRN-CPNP-PC; Lisa Ziemnik, MD, FAAP; Beth Williams, MBA, BSIE; Abiodun Omoloja, MD, MBA, CPE, FASN, FAMIA; Jennifer Morris, MS, APRN-CNP-PC, RNC-NIC; Maddie Mock, BSME; Thomas Geglein, BSN, RN, MBA; Kimberly Joo, DNP, APRN-CNP, CNE, EBP-C
Abstract
Background: Timely electronic health record (EHR) chart closure in pediatric urgent and express care settings is critical for accurate documentation, provider communication, and timely billing. Delays can compromise continuity of care and payer expectations. There is a need for immediate, accurate notes accessible to families and primary care providers.
Objective: To increase the percentage of charts closed within 1 hour of discharge from 81% to 95% across pediatric urgent and express care locations.
Methods: This quality improvement project was conducted using the Institute for Healthcare Improvement’s Model for Improvement and Plan-Do-Study-Act cycles. Key drivers included provider education, documentation tools, standardized charting, and real-time feedback. Interventions included implementation of Epic discharge SmartSets, one-on-one rounding by an Epic clinician builder who offered assistance, distribution of physical exam macros, and monthly blinded peer comparison of chart closure rates. Weekly reports tracked the percentage of charts closed within 1 hour.
Results: Baseline 1-hour closure averaged 81% from January 2023 to July 2023. After the introduction of incentivized SmartSets in August 2023, rates increased to 88%. Following one-on-one rounding, macro implementation, and peer comparison, rates rose further to 90% by May 2024. SmartSet usage for key diagnoses improved from 58% to 93% over the project period. Improvements were sustained despite variable patient volumes.
Conclusions: Department-specific EHR tools, individualized provider support, and standardized documentation practices led to improvement in timely chart closure. These results demonstrate that structured, data-driven interventions can improve documentation efficiency in busy pediatric on-demand care settings.
Introduction
Chart closure in a busy, on-demand pediatric healthcare setting is important for a multitude of reasons. These include patient safety, accurate charting, timely billing, enhanced tracking of provider workload, prompt access to notes for families, and communication with primary care providers.
Studies have shown that quick and accurate documentation enhances quality of care as well as patient safety.[1],[2] Charting immediately after evaluating a child allows for the most accurate documentation. The 21st Century Cures Act allows parents access to provider notes; parents/patients appreciate the ready access to their notes and find them useful.[3] Timely access allows the patient’s primary provider to have a thorough understanding of the patient’s complaint, diagnosis, treatment, and needed follow-up. Timeliness in chart closure is also important for billing because payers generally expect notes to be “generated at the time of service or shortly thereafter,”[4] with Medicare clearly stating that reasonable chart closure must be performed within 24 to 48 hours.4
Use of an effective electronic health record (EHR) can not only improve communication between providers, billers, and patients, but can also improve clinical decisions.1 EHRs can also leverage tools that enhance the use of best clinical practices.[5] There are multiple tools demonstrating the effective use of an EHR to improve patient safety; one of the most obvious being the medication administration record.[6] These tools include macros (pre-selected physical exam templates), “SmartPhrases” (specific short notes), and discharge “SmartSets” (a tool used to streamline and standardize discharge-diagnosis education). The discharge SmartSets are a key component to efficient charting in the on-demand setting.
Establishing methods to increase the number of charts closed in a timely manner while ensuring accurate documentation (and without overwhelming providers) is not a well-researched area. The first step is ensuring the providers have optimal training in using the EHR. However, many providers lack comprehensive training, and much of their training is delivered via video instead of in-person, creating greater variation in charting among providers.1 Meanwhile, in-person training is attributed to greater consistency.[7] This indicates a need for thorough, in person, one-on-one education regarding the use of the EHR. Another study reports “our results also support the hypothesis that consistency in the documentation production process has positive returns to quality, in that more consistent clinicians were more efficient in their documenting.”[8] We hypothesized that teaching providers how to be consistent and how to use the proper tools to chart quickly and efficiently could increase the number of charts closed in a timely manner.
Project Aim
The goal of this project was to increase the percentage of charts closed at pediatric on-demand (urgent care and express care) locations within 1 hour of patient discharge from a baseline of 81% to 95%.
Methods
This quality improvement project was performed at a pediatric teaching hospital and focused on urgent care and express care settings. The urgent care settings are typically staffed with 1 physician and 1-2 nurse practitioners. The express care clinics are always staffed by experienced pediatric advanced practice providers (APPs) and patient care assistants (PCAs) who have access to a collaborating physician by phone. Baseline staffing consists of 1 APP and 2 PCAs. Clinical hours of operation for both settings are 9–12-hour shifts, depending on location. The expected volume per provider is 3–4 patients per hour for each advanced practice provider and 4–5 patients per hour for each physician. Since all locations offer walk-in and online “save your spot” features, the number of patients seen by each provider per day is extremely variable. The division will see approximately 80,000 patients per year between 2 urgent cares and 5 express care locations.
This project focused on experienced pediatric physicians and nurse practitioners. Though the staffing numbers have varied over the course of this project, the average number of physicians consisted of 5 full-time pediatricians as well as 5–8 intermittent physicians. The average number of APPs consisted of approximately 28 full-time employees and 10 intermittent APPs. While the volume of pediatric patients seen varies by location and time of the year, maximum volumes at each express care location are set at 45 patients per day for a single provider, and an urgent care team of a single physician and APP can see up to 73 patients per 9 hours of operation.
The expectation is that all charts are completed by clinicians before leaving, or at least within 24 hours, to allow for the appropriate transfer of information to primary care by the next business day. The department has set an expectation that 90% of charts be closed within 1 hour of patient discharge, while 100% are expected to be closed within 24 hours of patient discharge. A contract incentive was established within the institution for 24-hour closure, however, there was no additional incentive to close charts within the 1-hour timeframe.
The EHR utilized by the providers to chart was the ASAP module of Epic Systems (Madison, Wisconsin).
Interventions
Prior to implementation, the hospital Internal Review Board determined this project was a quality improvement project and thus exempt from full review. The design and implementation of this project were organized using the Institute for Healthcare Improvement’s (IHI) Model for Improvement and Plan-Do-Study-Act (PDSA) cycles.[9]
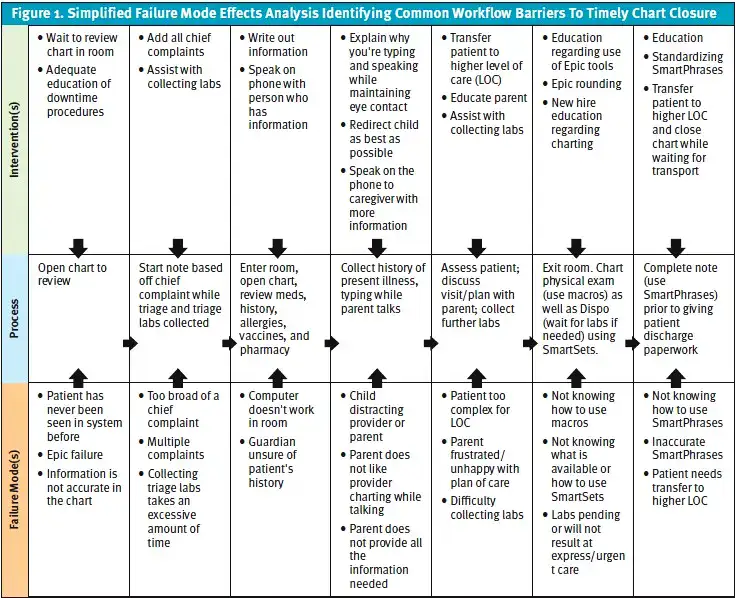
The quality improvement team consisted of the division chief for urgent care and express care clinics, a division APP Epic clinician builder (CB) (a provider with additional training from Epic), an Epic data analyst, and 3 nurse practitioners. All clinical providers, both physicians and APPs, participated in the chart closure project. Process mapping and a simplified failure mode effects analysis (sFMEA) was performed at the onset of this project to determine the process for charting while seeing patients in both the urgent care and express care settings (Figure 1).
Following the IHI Model of Improvement, a key driver diagram was created based on team feedback and the sFMEA. The key driver diagram consisted of 5 drivers: provider understanding of the importance of 1 hour chart closure; patient volume; division specific documentation training; standardized charting; and documentation tools. The interventions for the key driver diagram included: quality contract incentives for SmartSets; standardization of the method of documentation with all providers; implementation of one-on-one rounding on charting; and increased awareness of the documentation tools.
Interventions were grouped into primary PDSA ramps from July 1, 2023, to May 25, 2024.
- PDSA Ramp 1: Throughout the entire project, Epic discharge SmartSets for common diagnoses and complaints were created to specifically be used in the emergency department, urgent care, and express care settings. These SmartSets included best practice guidelines, treatment/medication recommendations, and parent discharge care instructions. Approximately 15 SmartSets were created prior to the start of this project with additional SmartSets added throughout the project for a total of 40 SmartSets available for provider use. Additionally, in July 2023, a value incentive was connected to 5 SmartSets, encouraging use for otitis media, bronchiolitis, strep pharyngitis, croup, and upper respiratory infection diagnoses.
- PDSA Ramp 2: From November 1, 2023, to May 25, 2024, one-on-one rounding with the Epic clinician builder (CB) began to support provider changes and improved clinician workflows.[10] The CB targeted 5 providers based on their low 1-hour chart closure rate. The CB watched the provider chart and then provided feedback to increase the speed of charting.
- PDSA Ramp 3: In December 2023, the CB created and distributed physical-exam macros for commonly evaluated illnesses (ear infections, upper respiratory infections, sore throat, normal physical exam) to all division providers to increase the speed of charting by decreasing the amount of clicks necessary in each chart.
- PDSA Ramp 4: In March 2024, a blinded comparison of chart closure rates was implemented to enhance engagement and buy-in to the 1-hour chart closure initiative. Individually, each provider was able to see how their rates compared to those of their peers. Monthly comparisons were performed 3 times(March 2024, April 2024, and May 2024).
Measures
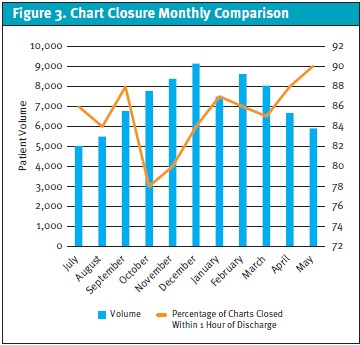
From January 1, 2023, to May 25, 2024, weekly data reports determined the percentage of all charts closed within 1 hour of patient discharge at all locations. The number of charts closed within 1 hour of encounter was divided by the total volume of patients seen at all locations to determine the rate. Chart closure rate was also compared to the total volume of patients seen at all locations in monthly increments.
Results
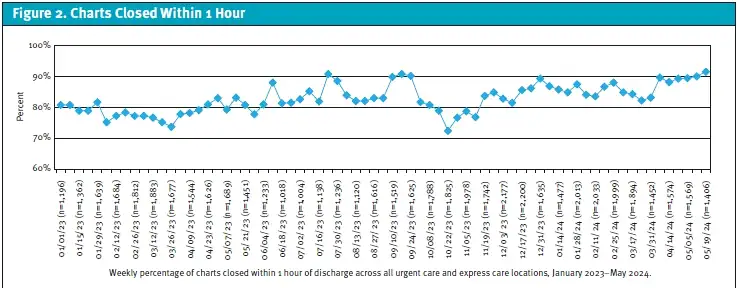
One-hour chart closure rates were reported following IHI quality improvement rules (Figure 2). One-hour chart closure rates were also reported in correlation with the clinic volume of patient encounters by all locations per month (Figure 3).
The baseline data for 1-hour chart closure was collected from January 1, 2023, to July 1, 2023, during which, the average rate of 1-hour chart closure was 81% (31,540 charts closed/38,901 patient encounters). Following implementation of the SmartSets value incentive, in August 2023, 1-hour chart closure rates elevated to 84% (4,623 charts closed/5,503 patient encounters), even further increasing in September 2023 to 88% (5,961 charts closed/6,774 patient encounters).
October 2023 saw a decrease in 1-hour chart closure rate to 78% (6,051 charts closed/7,758 patient encounters). However, following CB-implemented provider rounding in November 2023, there was an increase in the percentage of charts closed within 1 hour of discharge to 80% (6,708 charts closed/8,385 patient encounters). Physical exam macros were implemented in December 2023 with a 1-hour chart closure rate increase to 84% (7,681 charts closed/9,144 patient encounters). The 1-hour chart closure rate remained at 85% or above from January through March 2024. Following implementation of blinded provider feedback, the 1-hour chart closure rate was 88% (5,862 charts closed/6,661 patient encounters) in April 2024. The rate continued to increase in May 2024 to 90% (5,330 charts closed/5,922 patient encounters).
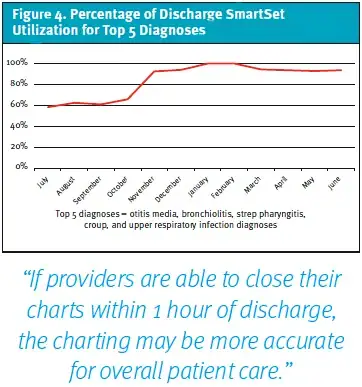
Utilization of the 5 value-incentivized SmartSets were monitored quarterly during the project, calculated by SmartSet usage divided by patients with an appropriate diagnosis. The use of these SmartSets increased from 58% to 93% from July 2023 to June 2024 (Figure 4).
Discussion
This quality improvement project with multiple interventions implemented via PDSA cycles resulted in an increase in the percentage of pediatric urgent care and express care charts closed within 1 hour.
The benefits of CB assistance were a key finding in this project. The CB was a provider who uses the system frequently and had certifications for tools to enhance the EHR. The CB was able to use dedicated time to improve the charting system for their own division while also working closely with their colleagues to find methods that were effective across the larger group.
The use of standardized tools was also effective in increasing 1-hour chart closure rates. Physical exam macros were created by the CB and shared with multiple providers, who said that the macros were useful and utilized daily, implying this improved charting efficiency. The use of discharge SmartSets was also helpful. As utilization of the discharge SmartSets for the top 5 diagnosis increased, so too did the rate of charts being closed within 1 hour of discharge.
Friendly competition was key to increasing 1-hour chart closure rates. The blind comparison among providers likely inspired an increase in the overall chart closure rates, and the performance data likely provided the motivation for self-improvement.
The baseline mean rate of 1-hour chart closure prior to intervention was 81%. From the week of December 17, 2023, the mean shifted from 81% to 87% and maintained that 87% until the end of the project in May 2024. Even though it was below the goal of 95%, this increase was impactful. The shift in the mean represented the closure of an additional 5,000 charts per year within the 1-hour timeframe. The continued increase in the mean—even with a seasonal volume increase in patients—was attributed to the project interventions.
These findings are particularly useful in an urgent care. If providers are able to close their charts within 1 hour of discharge, the charting may be more accurate for overall patient care. Using SmartSets allows for efficient discharges, and patients can be treated with the most up-to-date, evidence-based plan by every provider.
Using the charting system to optimal capability improves physicians’ workload and performance.[11] Physicians who use their EHRs more fully are also more satisfied with their systems.[12] If clinicians are appropriately trained in the use of EHR tools and time-saving methods, teams can be more efficient overall.
Limitations
This project has several limitations. No evaluation of the quality of the charts closed within 1 hour of discharge was performed. It was not determined if the quality and accuracy of the notes were maintained with an increased rate of closure. The utilization of SmartSets that were outside of the top 5 diagnoses were also not evaluated during this project. Additionally, this project was limited to a single group of pediatric urgent care and express care clinics, which limits its generalizability to other care locations.
Conclusion
Embedding a division CB to provide coached EHR rounding, standard EHR tools (including SmartSets, macros, and SmartPhrases), and utilizing IHI quality improvement methodology resulted in an increase in the 1-hour chart closure rate of pediatric urgent care and retail express care clinics.
Acknowledgement
The authors wish to thank Kelly Sandberg, MD, MSc, Dayton Children’s Hospital.
Manuscript submitted May 8, 2025; accepted November 7, 2025.
References
- [1]. DesRoches CM, Campbell EG, Rao SR, et al. Electronic health records in ambulatory care–a national survey of physicians. N Engl J Med. 2008;359(1):50-60. doi:10.1056/NEJMsa0802005
- [2]. Franklin BD, Puaar S. What is the impact of introducing inpatient electronic prescribing on prescribing errors? A naturalistic stepped wedge study in an English teaching hospital. Health Informatics J. 2020;26(4):3152-3162. doi:10.1177/1460458219833112
- [3]. Bates DW, Landman AB. Use of Medical Scribes to Reduce Documentation Burden: Are They Where We Need to Go With Clinical Documentation?. JAMA Intern Med. 2018;178(11):1472-1473. doi:10.1001/jamainternmed.2018.3945
- [4]. Pelaia, Robert. Medical Record Entry Timeliness: What Is Reasonable? AAPC Knowledge Center. AAPC.com. Published 2019. https://www.aapc.com/blog/23844-medical-record-entry-timeliness-what-is-reasonable/
- [5]. Kavanagh C. Medication governance: preventing errors and promoting patient safety. Br J Nurs. 2017;26(3):159-165. doi:10.12968/bjon.2017.26.3.159
- [6]. Agrawal A, Wu WY. Reducing medication errors and improving systems reliability using an electronic medication reconciliation system. Jt Comm J Qual Patient Saf. 2009;35(2):106-114. doi:10.1016/s1553-7250(09)35014-x
- [7]. Cohen GR, Friedman CP, Ryan AM, Richardson CR, Adler-Milstein J. Variation in Physicians’ Electronic Health Record Documentation and Potential Patient Harm from That Variation. J Gen Intern Med. 2019;34(11):2355-2367. doi:10.1007/s11606-019-05025-3
- [8]. Apathy NC, Biro J, Holmgren AJ. Consistency is key: documentation distribution and efficiency in primary care. J Am Med Inform Assoc. 2024;31(8):1657-1664. doi:10.1093/jamia/ocae156
- [9]. Institute for Healthcare Improvement. Quality Improvement Essentials Toolkit. Ihi.org. Published 2025. https://www.ihi.org/library/tools/quality-improvement-essentials-toolkit
- [10]. Epic. Physician and clinical content builders. Epic UserWeb website. Updated December 19, 2023. Accessed January 17, 2025. https://galaxy.epic.com/
- [11]. Mazur LM, Mosaly PR, Moore C, Marks L. Association of the Usability of Electronic Health Records With Cognitive Workload and Performance Levels Among Physicians. JAMA Netw Open. 2019;2(4):e191709. Published 2019 Apr 5. doi:10.1001/jamanetworkopen.2019.1709
- [12]. Holmgren AJ, Hendrix N, Maisel N, et al. Electronic Health Record Usability, Satisfaction, and Burnout for Family Physicians. JAMA Netw Open. 2024;7(8):e2426956. Published 2024 Aug 1. doi:10.1001/jamanetworkopen.2024.26956
Author Affiliations: Kileen Fernandez, MS, APRN-CPNP-PC, Dayton Children’s Hospital. Lisa Ziemnik, MD FAAP, Dayton Children’s Hospital. Beth Williams, MBA, BSIE, Dayton Children’s Hospital. Abiodun Omoloja MD, MBA, CPE, FASN, FAMIA, Dayton Children’s Hospital. Jennifer Morris, MS, APRN-CNP-PC, RNC-NIC, Dayton Children’s Hospital. Maddie Mock, BSME, Dayton Children’s Hospital. Thomas Geglein, BSN, RN, MBA, Dayton Children’s Hospital. Kimberly Joo, DNP, APRN-CNP, CNE, EBP-C, Dayton Children’s Hospital. Authors have no relevant financial relationships with any ineligible companies.